Giỏ hàng
0 Sản Phẩm

6.666.855₫
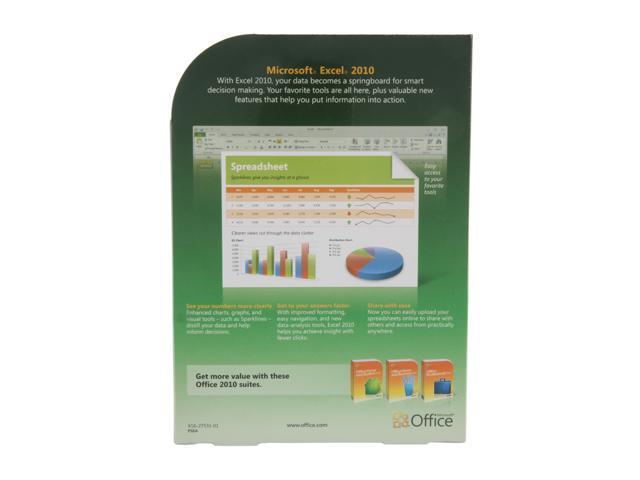
Analyze, manage, and share information
Powerful data analysis and visualization tools
Access your spreadsheets from virtually anywhere
if (typeof (Webcollage) == “undefined”) {
jQuery.ajax({
type: “GET”,
url: “https://scontent.webcollage.net/api/v2/product-content”,
success: function () {
Webcollage.loadContent(“newegg”,
“9SIA4FT1PK5545″;”,
{ reload: true })
},
dataType: ‘script’,
cache: true
});
} else {
Webcollage.loadContent(“newegg”,
“9SIA4FT1PK5545″;”,
{ reload: true })
}
 Create Data Charts in a Single CellWith Sparklines, a new feature in Excel 2010, you can create small charts in a single cell to quickly discover patterns in your data. It’s a quick and easy way to highlight important data trends such as seasonal increases or decreases, saving you time.
 Zero in on the Right Data Points QuicklyExcel 2010 delivers new and exciting filter enhancements. The Slicer feature provides you with a rich visualization of your PivotTable and PivotChart views so you can dynamically segment and filter the data to display precisely what you need. With the new search filter, you can spend less time sifting through large data sets in your tables, PivotChart and PivotTable views, and more time analyzing.
 Efficiently Model and Analyze Almost Any DataThe PowerPivot for Excel 2010 add-in, a free download, provides groundbreaking technology such as streamlined integration of data from multiple sources and lightning-fast manipulation of large data sets with up to millions of rows. Business users can effortlessly publish and share analysis through Microsoft SharePoint Server 2010, and have other users enjoy the same Slicer, PivotTable, and fast-query capabilities when working on their Excel Services report.
 Access Your Spreadsheets from Virtually AnywherePost your spreadsheets online and then access, view, and edit wherever from just about any computer or your Windows phone. With Excel 2010, you can take advantage of a best-in-class spreadsheet experience across multiple locations and devices.
 Connect, Share, and Accomplish More when Working TogetherCo-authoring through the Microsoft Excel Web App makes it possible for you to edit the same spreadsheet with others simultaneously from different locations. You can see who’s working on a spreadsheet with you at the same time. See changes from others appear as they are made. And with the number of editors in the workbook shown on the status bar, you’ll always know who else is editing the workbook with you.
 Add More Sophistication to Your Data PresentationsConditional Formatting in Excel 2010 gives you more control over styles and icons, improved data bars, and the ability to highlight specific items in a few clicks. You also can display data bars for negative values to more accurately illustrate your data visuals.
| Brand | Microsoft |
|---|---|
| Model | 065-06962 |
| Type | Office Suite |
| Name | Office Excel 2010 |
|---|---|
| Operating Systems Supported Operating Systems Supported | Windows |
| Packaging Packaging | SMBOX |
| System Requirements | 500-megahertz (MHz) processor or higher
256 megabytes (MB) of RAM or higher 2 gigabyte (GB) available disk space 1024 × 576 or higher resolution monitor Video card requirements: Pixel Shader 20 and Vertex Shader 2.0. Driver date later than Nov. 1, 2004. WHQL certified Windows XP with Service Pack (SP) 3 (32-bit), Windows Vista with SP1, Windows Server 2003 R2 with MSXML 6.0, Windows Server 2008 with SP2 (32-bit or 64-bit), Windows 7 or later operating systems. |
| Feature | Microsoft Excel 2010 makes it possible to analyze, manage, and share information in more ways than ever before, helping you make better, smarter decisions. New analysis and visualization tools help you track and highlight important data trends. Easily access your important data on the go from almost any Web browser or smartphone.1 You can even upload your files to the Web and work simultaneously with others online. Whether you’re producing financial reports or managing personal expenses, Excel 2010 gives you more efficiency and flexibility to accomplish your goals.
Make fast, effective comparisons Get a visual summary of your data using tiny charts that fit within a cell alongside your text data with new Sparklines. Quickly, intuitively filter large amounts of information using new Slicer functionality and enhance your PivotTable and PivotChart visual analysis. PowerPivot for Excel 2010, a free add-in, lets you experience fast manipulation of large data sets (often in millions of rows) and streamlined data integration. And you can effortlessly share your analysis through SharePoint Server 2010.2 |
|---|
| Date First Available | October 18, 2022 |
|---|


NGUỒN HÀNG ĐẢM BẢO
Hàng hóa trên HQG.VN được bán bởi các các nhà cung cấp lớn và uy tín nhất thế giới.

GIÁ CẢ CẠNH TRANH
HQG.VN đem đến cơ hội mua sắm hàng hóa chất lượng quốc tế, giá Việt Nam cho tất cả mọi người.

GIAO HÀNG TOÀN QUỐC
HQG.VN giao hàng miễn phí tới tất cả 63 tỉnh thành trên toàn quốc.

THANH TOÁN THUẬN TIỆN
Hỗ trợ nhiều phương thức thanh toán. Được đảm bảo an toàn tuyệt đối bởi nganluong.vn

BẢO HÀNH SẢN PHẨM
HQG.VN có chính sách bảo hành chính hãng cho các sản phẩm

HỖ TRỢ 24/7
Tổng đài hỗ trợ: 028.7309.6999
Bảo hành 24/7: 1900636106


if (typeof (Webcollage) == “undefined”) {
jQuery.ajax({
type: “GET”,
url: “https://scontent.webcollage.net/api/v2/product-content”,
success: function () {
Webcollage.loadContent(“newegg”,
“9SIA4FT1PK5545″;”,
{ reload: true })
},
dataType: ‘script’,
cache: true
});
} else {
Webcollage.loadContent(“newegg”,
“9SIA4FT1PK5545″;”,
{ reload: true })
}
Create Data Charts in a Single CellWith Sparklines, a new feature in Excel 2010, you can create small charts in a single cell to quickly discover patterns in your data. It’s a quick and easy way to highlight important data trends such as seasonal increases or decreases, saving you time.Zero in on the Right Data Points QuicklyExcel 2010 delivers new and exciting filter enhancements. The Slicer feature provides you with a rich visualization of your PivotTable and PivotChart views so you can dynamically segment and filter the data to display precisely what you need. With the new search filter, you can spend less time sifting through large data sets in your tables, PivotChart and PivotTable views, and more time analyzing.Efficiently Model and Analyze Almost Any DataThe PowerPivot for Excel 2010 add-in, a free download, provides groundbreaking technology such as streamlined integration of data from multiple sources and lightning-fast manipulation of large data sets with up to millions of rows. Business users can effortlessly publish and share analysis through Microsoft SharePoint Server 2010, and have other users enjoy the same Slicer, PivotTable, and fast-query capabilities when working on their Excel Services report.Access Your Spreadsheets from Virtually AnywherePost your spreadsheets online and then access, view, and edit wherever from just about any computer or your Windows phone. With Excel 2010, you can take advantage of a best-in-class spreadsheet experience across multiple locations and devices.Connect, Share, and Accomplish More when Working TogetherCo-authoring through the Microsoft Excel Web App makes it possible for you to edit the same spreadsheet with others simultaneously from different locations. You can see who’s working on a spreadsheet with you at the same time. See changes from others appear as they are made. And with the number of editors in the workbook shown on the status bar, you’ll always know who else is editing the workbook with you.Add More Sophistication to Your Data PresentationsConditional Formatting in Excel 2010 gives you more control over styles and icons, improved data bars, and the ability to highlight specific items in a few clicks. You also can display data bars for negative values to more accurately illustrate your data visuals.| Brand | Microsoft |
|---|---|
| Model | 065-06962 |
| Type | Office Suite |
| Name | Office Excel 2010 |
|---|---|
| Operating Systems Supported Operating Systems Supported | Windows |
| Packaging Packaging | SMBOX |
| System Requirements | 500-megahertz (MHz) processor or higher
256 megabytes (MB) of RAM or higher 2 gigabyte (GB) available disk space 1024 × 576 or higher resolution monitor Video card requirements: Pixel Shader 20 and Vertex Shader 2.0. Driver date later than Nov. 1, 2004. WHQL certified Windows XP with Service Pack (SP) 3 (32-bit), Windows Vista with SP1, Windows Server 2003 R2 with MSXML 6.0, Windows Server 2008 with SP2 (32-bit or 64-bit), Windows 7 or later operating systems. |
| Feature | Microsoft Excel 2010 makes it possible to analyze, manage, and share information in more ways than ever before, helping you make better, smarter decisions. New analysis and visualization tools help you track and highlight important data trends. Easily access your important data on the go from almost any Web browser or smartphone.1 You can even upload your files to the Web and work simultaneously with others online. Whether you’re producing financial reports or managing personal expenses, Excel 2010 gives you more efficiency and flexibility to accomplish your goals.
Make fast, effective comparisons Get a visual summary of your data using tiny charts that fit within a cell alongside your text data with new Sparklines. Quickly, intuitively filter large amounts of information using new Slicer functionality and enhance your PivotTable and PivotChart visual analysis. PowerPivot for Excel 2010, a free add-in, lets you experience fast manipulation of large data sets (often in millions of rows) and streamlined data integration. And you can effortlessly share your analysis through SharePoint Server 2010.2 |
|---|
| Date First Available | October 18, 2022 |
|---|